- Purchase 400 shares of KORS
- Confirm purchase
- Sell 4 September call contracts
- Confirm sale
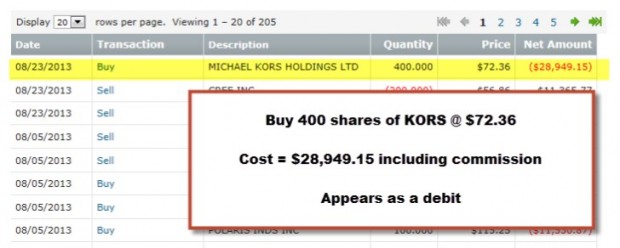
Confirmed purchase of 400 x KORS @ $72.36
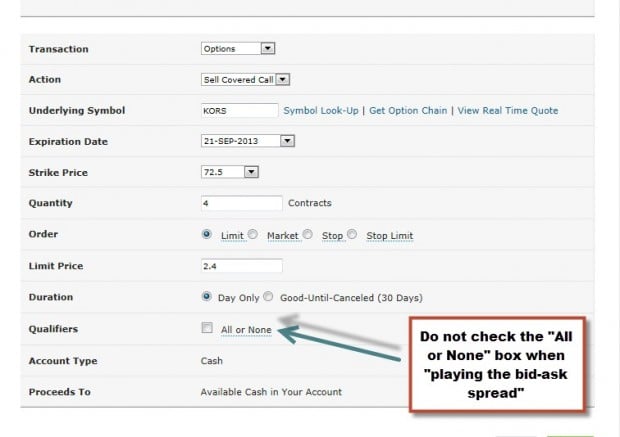
Selling a covered call option for KORS
- The first 6 lines are self-explanatory
- We enter a limit order, not a market order
- We enter a limit price based on the bid-ask spread shown in an options chain
- The order is day only
- ***DO NOT CHECK THE ALL OR NONE BOX when playing the bid-ask spread (224 – 228 of Encyclopedia…)
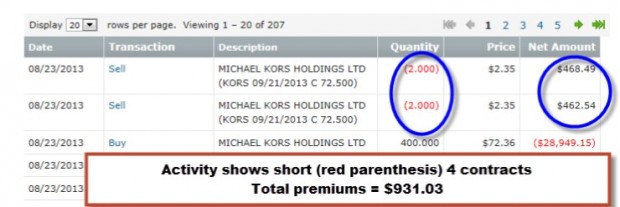
4 Sept. $72.50 calls sold for KORS
- 4 contracts were confirmed sold for a total of $931.03, including commissions
- My initial 1-month return is $931.03/$28,949.15 = 3.2%, 1-month return, after commissions
- Notice the option price dropped from $2.40 to $2.35 while I was creating these slides (took one for the team!)
- The contracts appear in red parenthesis because I am short these contracts (I sold them and have an obligation)
- Since I am long the shares, they appear in black and NOT in parenthesis
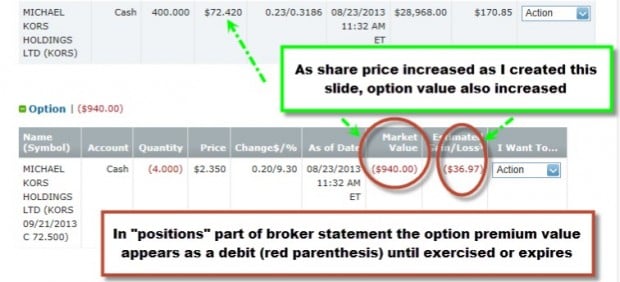
KORS: stock and options positions
- As share value started to rise after the trade was executed so did the value of the option premium
- Option value appears as a debit (red) because the cost to buy back is greater than the premium received.
- This is deceiving because an increase in share value is a positive for us. This is simply an accounting technique used by brokerages which we must understand
- The 4 contracts also appear in red because I am short these contracts and still hold an options obligation
- The cash generated from the sale of the options IS in the cash portion of my account and available to trade with
- Once the options expire or are bought back or exercised the apparent debits and short positions are deleted from the positions section of the broker statement. The cash, of course, is ours to keep.
- Existing home sales increased by 6.5% in July to an annual rate of 5.39 million, above the 5.16 million expected and the highest rate in 3 years
- Median price of homes rose by 13.7% from a year ago
- Inventories of existing homes remain 5% below the level of a year ago
- New home sales fell by 13.4% in July to an annualized rate of 394,000, the lowest level since October, 2012 but 7% higher than a year ago
- Median prices of new homes are 8.3% higher than a year ago
- Minutes of the July 30-31 FOMC meeting sent mixed signals as to when “tapering” of the Fed’s purchasing of Treasury bonds and mortgage-backed securities would begin. It appears that policy changes will be gradual and dependent on current economic conditions
- The Conference Board’s index of leading economic indicators (a composite index of ten economic indicators that typically lead overall economic activity. The index includes indicators such as housing permits, new orders for consumer goods, consumer expectations, and performance of the S&P 500 Index) rose 0.6% in July, better than anticipated. The growth rate in the past 6 months has nearly doubled, boding well for expansion in the near term


7 comments… add one
Repeat Posting in case you missed it…
I saw this article this morning and I thought it would be of interest to all of The Blue Collar Investor community…
Ask Matt: Are apps a safe way to make trades?
Matt Krantz, USA TODAY11:40 p.m. EDT August 22, 2013
STORY HIGHLIGHTS
• Online brokers are providing trading tools for users’ mobile devices
• Consumers must make sure they’re connected to secure networks
• Trading on smartphones and tablets expected to get more popular
USA TODAY markets reporter Matt Krantz answers a different reader question every weekday. To submit a question, e-mail Matt at mkrantz@usatoday.com.
Q: Are apps a safe way to make trades?
A: Online brokers are eager for mobile trading to catch on. After all, anything that makes trading easier and impulsive is likely to cause more trading and more commissions being paid.
Most of the major brokerages have now released apps for the major mobile platforms including iOS, Android, Windows Phone and Windows 8. The capabilities of these apps vary by platform. Some only allow users to view their balances or check stock prices, while many allow customers to buy and sell investments.
But investors are wise to stop and think before they enter their username or password into any device, especially a portable one. When logging into a brokerage account, it’s important to make sure the device is connected to a secure network.
Wifi is fine when investors are at home and connected to their secure wireless networks. When traveling, though, investors are best served to be connected to the cellular network, rather than an open and public wireless hotspot where it can be easier for bad guys to steal passwords.
When using a laptop, it’s best to first connect to a virtual private network, or VPN. Many companies provide employees with access to a VPN, but there are others that consumers can use, too.
Best,
Barry
Hi Alan,
I have a question for selling in the money or out of money:
Say i buy at $40.11 and can sell at $1.05 for $40 in the money, or I can sell out of money at $0.5 for $41.
My question is that is it always the best practice to do in the money since
1) I get better premium
2) if it called out at $41 (out of money), then I gain extra $89
3) if it called out at $40 (in the money), then I have down side production
Thus I have better premium and down side protection and extra gain if called out at out of money—-all with selling in the money. Why should I ever consider to do selling out of money?
Keith
Keith,
ITM strikes offer the initial return of time value plus downside protection of that profit (very small in your hypothetical) while the OTM strike will offer the intial return of time value plus upside potential of share appreciation up to the strike price. The best way to evaluate which is a better strike to use is to feed the options chain information into the single or multiple tab of the Ellman Calculator. In the screenshot below please note the following:
$40 strike generates an initial return of 2.4% (33.7% annualized) and downside protection of 0.3%.
$41 strike offers an initial return of 1.2%, Upside of 2.4% and potential 1-month return of 3.4% (47.7% annualized).
Each strike has its advantages and disadvantages and based on your overall market assessment, chart technicals and personal risk tolerance the best decision can be achieved.
See the screenshot below taken from the single tab of the Basic Ellman Calculator (CLICK ON IMAGE TO ENLARGE AND USE BACK ARROW TO RETURN TO BLOG:
Alan
Premium Members,
This week’s Weekly Stock Screen And Watch List has been uploaded to The Blue Collar Investor premium member site and is available for download in the “Reports” section. Look for the report dated 08-23-13.
Also, be sure to check out the latest BCI Training Videos and “Ask Alan” segments. You can view them at The Blue Collar YouTube Channel. For your convenience, the link to the BCI YouTube Channel is:
http://www.youtube.com/user/BlueCollarInvestor
Best,
Barry and The BCI Team
Alan,
You have probably answered this question before but I haven’t seen it in your recent articles so I hope you don’t mind. I understand that time value is our profit and not intrinsic value so is it important for us to look up theta when selling covered calls? Also why do some traders say that theta is hard to predict?
Thank you very much.
Joan
Joan,
You are absolutely correct that we are selling time value which includes time to expiration and implied volatility along with a few minor other factors. Understanding the concept of theta (rate at which an option will lose time value) is critical but actually looking up theta stats is NOT necessary. We know that time value accelerates as expiration approaches therefore we want to sell our options early in the 1-month cycle.
The reason some may say that theta is hard to predict is because the rate of erosion is non linear in nature.
Feel free to use the google search tool on the top of all the web pages to access information on a particular topic.
See the graph below tp view the non linear movement of time erosion (CLICK ON IMAGE TO ENLARGE AND USE THE BACK ARROW TO RETURN TO BLOG):
Alan
Running list stocks in the news: CRZO:
Carrizo Oil&Gas is a small cap energy company specializing in exploration and production of oil and natural gas. On August 7th, CRZO beat earnings expectations by $0.06 as revenues rose by 60% year-over-year. Our Premium “Running List” shows an industry rank of “B” and a beta of 1.91. As a result analysys are raising earnings estimates as shown in the chart below (CLICK ON IMAGE TO ENLARGE AND USE BACK ARROW TO RETURN TO BLOG):
Alan